Triangle BreakDown Technical Pattern
Learn about the Triangle Bearish Breakout pattern in stock trading - a continuation pattern that signals potential downward movement. Understand how to identify and trade this technical analysis pattern effectively with volume analysis and key indicators.
Recent Triangle BreakDown Patterns
15 patterns found
Kardan Real Estate Enterprise and Development Ltd
IL
Market Cap: 360.82M
Industry: Real Estate Services
Triangle BreakDown
12/14/2025
Continuation pattern with converging trendlines, breaking downward to signal potential bearish momentum
TuanChe Limited
CN
Market Cap: 1.92M
Industry: Werbungsagentur
Triangle BreakDown
12/11/2025
Continuation pattern with converging trendlines, breaking downward to signal potential bearish momentum
Immsi S.p.A
IT
Market Cap: 212.86M
Industry: Auto Manufacturers
Triangle BreakDown
12/10/2025
Continuation pattern with converging trendlines, breaking downward to signal potential bearish momentum
United Electronics Company
SA
Market Cap: 1.78B
Industry: Specialty Retail
Triangle BreakDown
12/10/2025
Continuation pattern with converging trendlines, breaking downward to signal potential bearish momentum
Trugolf Inc
US
Market Cap: 1.64M
Industry: Leisure
Triangle BreakDown
12/10/2025
Continuation pattern with converging trendlines, breaking downward to signal potential bearish momentum
Deswell Industries Inc
MO
Market Cap: 56.68M
Industry: Electronic Components
Triangle BreakDown
12/10/2025
Continuation pattern with converging trendlines, breaking downward to signal potential bearish momentum
Aegon NV
NL
Market Cap: 12.33B
Industry: Insurance - Diversified
Triangle BreakDown
12/10/2025
Continuation pattern with converging trendlines, breaking downward to signal potential bearish momentum
Dropbox Inc
US
Market Cap: 7.35B
Industry: Software - Infrastructure
Triangle BreakDown
12/10/2025
Continuation pattern with converging trendlines, breaking downward to signal potential bearish momentum
LumenRadio AB
SE
Market Cap: 73.11M
Industry: Communication Equipment
Triangle BreakDown
12/10/2025
Continuation pattern with converging trendlines, breaking downward to signal potential bearish momentum
JET2 PLC
US
Market Cap: 60.85M
Industry: Oil & Gas Equipment & Services
Triangle BreakDown
12/10/2025
Continuation pattern with converging trendlines, breaking downward to signal potential bearish momentum
Brenmiller Energy Ltd
IL
Market Cap: 4.44M
Industry: Utilities - Renewable
Triangle BreakDown
12/9/2025
Continuation pattern with converging trendlines, breaking downward to signal potential bearish momentum
AA Mission Acquisition Corp.
US
Market Cap: 367.08M
Industry: Shell Companies
Triangle BreakDown
12/9/2025
Continuation pattern with converging trendlines, breaking downward to signal potential bearish momentum
EUDA Health Holdings Limited
SG
Market Cap: 102.73M
Industry: Real Estate Services
Triangle BreakDown
12/9/2025
Continuation pattern with converging trendlines, breaking downward to signal potential bearish momentum
Blink Charging Co
US
Market Cap: 137.48M
Industry: Engineering & Construction
Triangle BreakDown
12/8/2025
Continuation pattern with converging trendlines, breaking downward to signal potential bearish momentum
EUDA Health Holdings Limited
SG
Market Cap: 102.73M
Industry: Real Estate Services
Triangle BreakDown
12/5/2025
Continuation pattern with converging trendlines, breaking downward to signal potential bearish momentum
Want to see more technical patterns?
Access our full platform with advanced filtering, real-time alerts, and comprehensive market analysis.
View Full Platform →About Triangle BreakDown Patterns
Triangle BreakDown patterns are technical chart formations that traders and investors use to identify potential entry and exit points. These patterns are based on historical price movements and can help predict future price direction.
Understanding the Triangle Bearish Breakout in Stocks
What is the Triangle Bearish Breakout Pattern in Stocks?
The Triangle Bearish Breakout pattern is a continuation pattern that appears during a downtrend, indicating a potential continuation of the downward movement. This pattern forms when the price of a stock consolidates within converging trendlines, creating a triangular shape, before breaking out to the downside. In stock trading, the Triangle Bearish Breakout pattern is significant because it often signals the continuation of a bearish trend. Recognizing this pattern can help traders anticipate price movements and make strategic trades.
How to Identify Triangle Bearish Breakout Patterns
Identifying the Triangle Bearish Breakout pattern involves several key steps:
- Downtrend: Look for a clear downtrend leading into the pattern.
- Consolidation: The price consolidates within converging trendlines, forming a triangle.
- Breakout: The price breaks below the lower trendline, confirming the pattern.
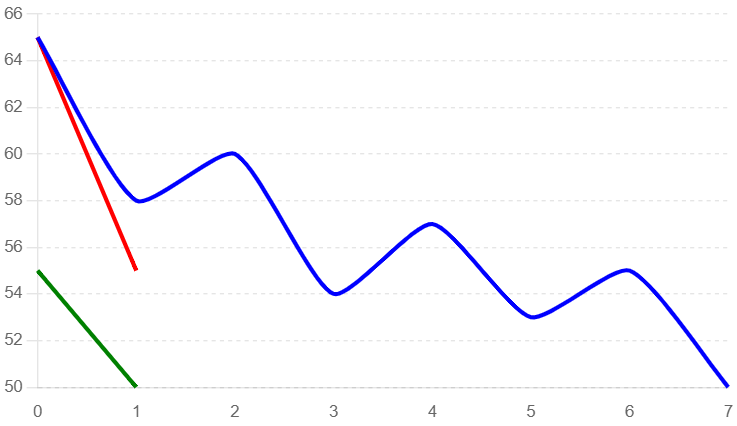
Identifying a Triangle Bearish Breakout Pattern
In this example, we use a typical candlestick chart to illustrate the formation of a Triangle Bearish Breakout pattern. Key elements to observe include the downtrend, the consolidation phase, and the subsequent breakout.
- Downtrend: The price of the stock shows a clear downward trend leading into the pattern.
- Consolidation: The price consolidates within converging trendlines, forming a triangle.
- Breakout Confirmation: The price breaks below the lower trendline, confirming the pattern.
Triangle Bearish Breakout Pattern
Key Indicators
- Volume Spikes: Increased trading volume often accompanies the breakout, indicating strong selling interest.
- Trendlines: Converging trendlines forming the triangle.
- Candlestick Patterns: Look for bearish candlestick patterns near the breakout point.
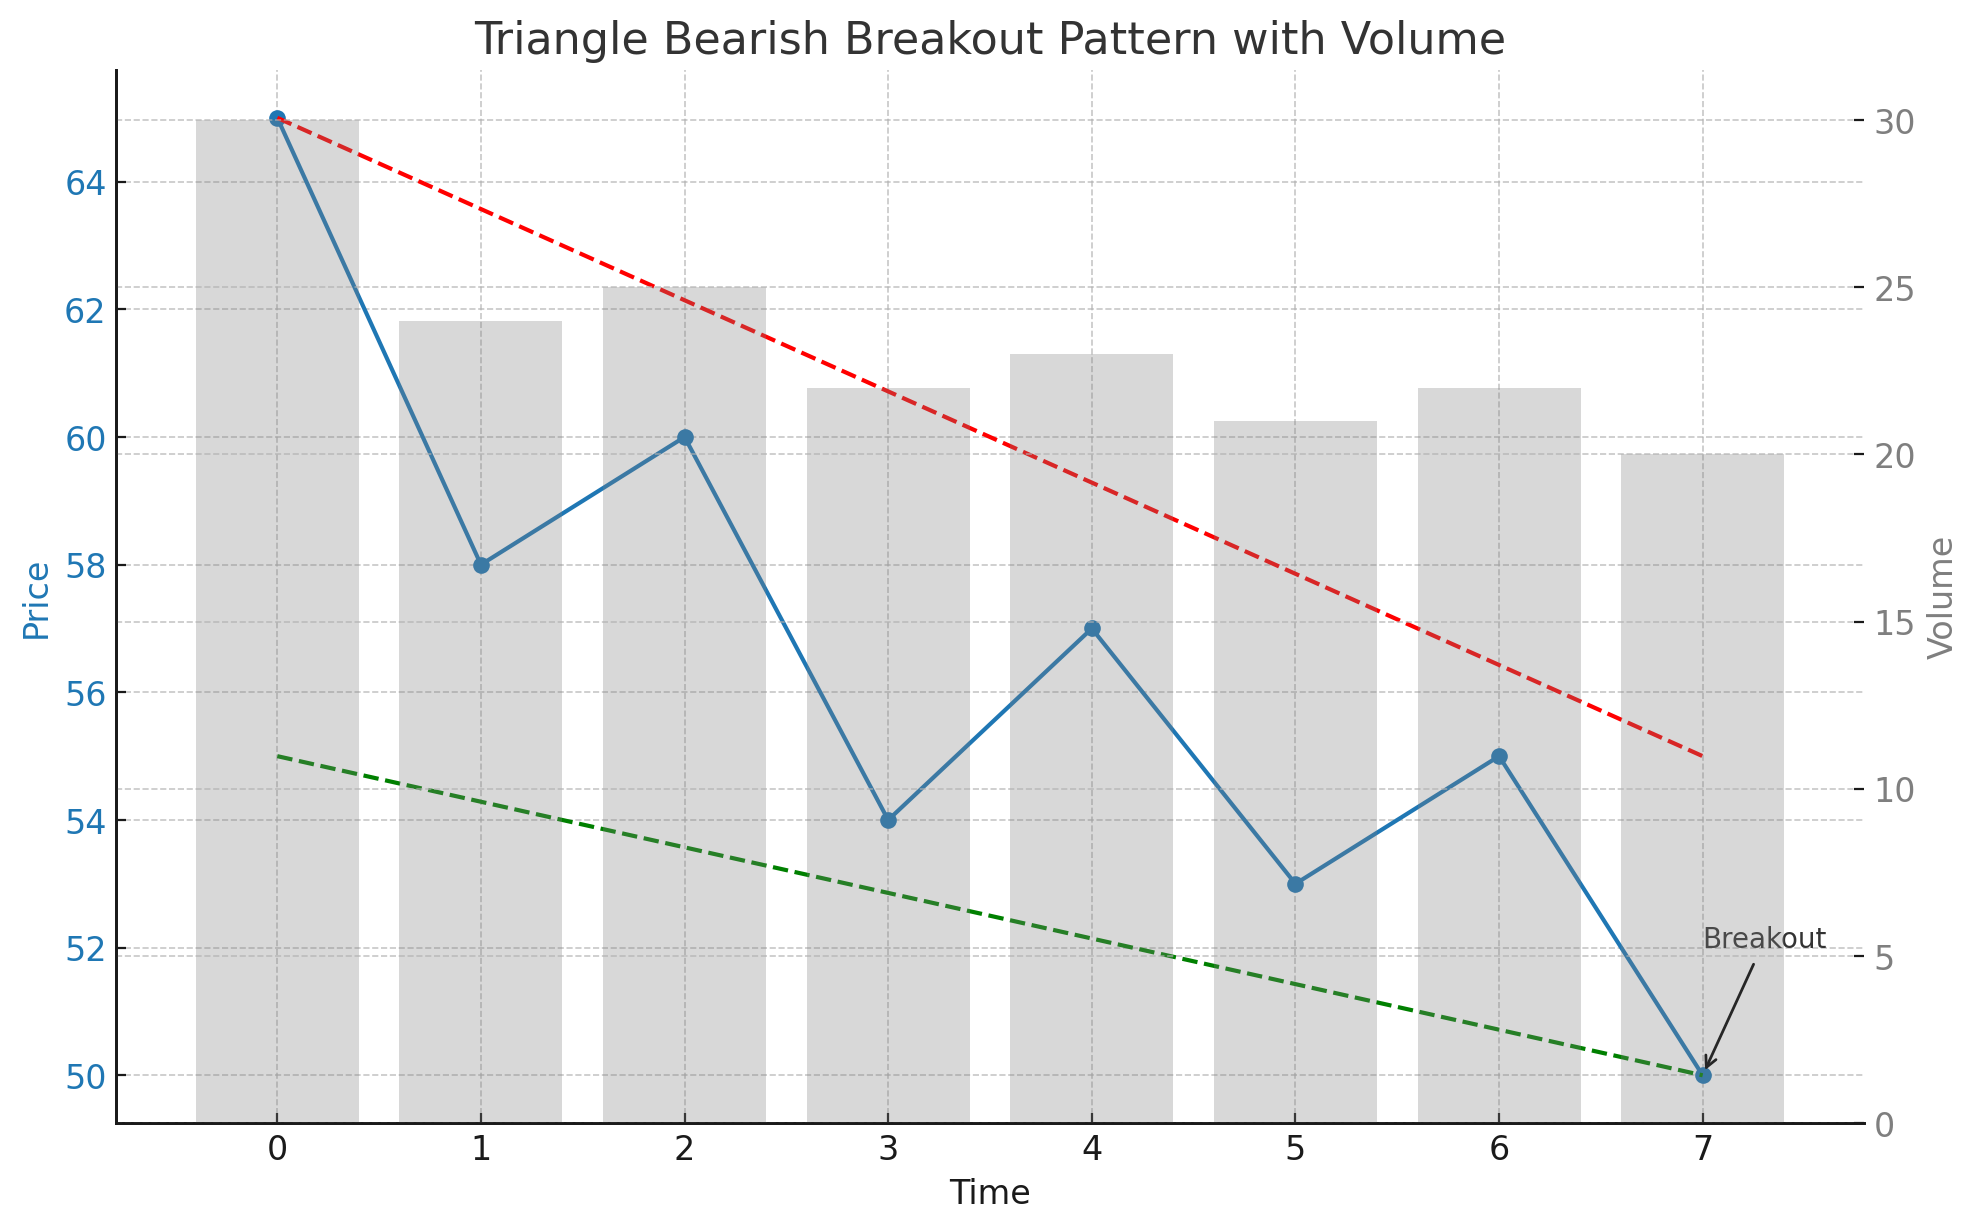
Triangle Bearish Breakout Pattern with Volume Analysis
This example highlights the role of volume in confirming the Triangle Bearish Breakout pattern. Volume analysis can provide additional confidence in the pattern's validity.
- Downtrend: The price trend is downward, characterized by decreasing prices and moderate volume.
- Consolidation: The price consolidates within converging trendlines with moderate volume.
- Breakout: The price breaks below the lower trendline with a significant spike in volume, confirming the pattern.
Triangle Bearish Breakout Pattern with Volume
Frequently Asked Questions
What is the Triangle Bearish Breakout pattern in stock trading?
The Triangle Bearish Breakout pattern in stock trading is a continuation pattern that appears during a downtrend. It indicates a potential continuation of the downward movement and is characterized by the price consolidating within converging trendlines before breaking out to the downside.
How reliable is the Triangle Bearish Breakout pattern in stocks?
The Triangle Bearish Breakout pattern is considered a reliable bearish continuation signal in stock trading, especially when confirmed by increased trading volume and a strong breakout below the lower trendline. However, it should be used alongside other technical analysis tools.
Can the Triangle Bearish Breakout pattern appear in any stock?
Yes, the Triangle Bearish Breakout pattern can appear in any stock. It is a widely applicable chart pattern used in technical analysis across various assets, including stocks.
What common mistakes should be avoided when trading the Triangle Bearish Breakout pattern?
Common mistakes include entering the trade too early before the breakout confirmation, not confirming the pattern with volume analysis, and failing to set appropriate stop-loss levels to manage risk. By understanding and utilizing the Triangle Bearish Breakout pattern, traders can better anticipate bearish continuations and optimize their trading strategies for improved outcomes in the stock market.
What are the key indicators to consider when trading the Triangle Bearish Breakout pattern in stocks?
Key indicators include identifying significant trendlines, confirming the pattern with increased volume during the breakout, and observing bearish candlestick patterns near the breakout point. These indicators help validate the Triangle Bearish Breakout pattern and provide insights for potential significant price movements.