Multiple Top Technical Pattern
Learn about the Multiple Top pattern in stock trading - a bearish reversal pattern that signals potential downward movement. Understand how to identify and trade this technical analysis pattern effectively with volume analysis and key indicators.
Recent Multiple Top Patterns
15 patterns found
Heartland Express Inc
US
Market Cap: 726.62M
Industry: Trucking
Multiple Top
12/11/2025
Bearish pattern with three or more peaks at similar price levels, indicating strong resistance
Rush Enterprises Inc
US
Market Cap: 4.23B
Industry: Auto & Truck Dealerships
Multiple Top
12/11/2025
Bearish pattern with three or more peaks at similar price levels, indicating strong resistance
East Pipes Integrated Company for Industry
SA
Market Cap: 1.22B
Industry: Steel
Multiple Top
12/11/2025
Bearish pattern with three or more peaks at similar price levels, indicating strong resistance
Sam-A Aluminium Co. Ltd.
KR
Market Cap: 240.53M
Industry: Aluminum
Multiple Top
12/11/2025
Bearish pattern with three or more peaks at similar price levels, indicating strong resistance
Fulton Financial Corp
US
Market Cap: 3.43B
Industry: Banks - Regional
Multiple Top
12/11/2025
Bearish pattern with three or more peaks at similar price levels, indicating strong resistance
Cactus Inc
US
Market Cap: 3.25B
Industry: Oil & Gas Equipment & Services
Multiple Top
12/11/2025
Bearish pattern with three or more peaks at similar price levels, indicating strong resistance
Wallenius Wilhelmsen ASA
NO
Market Cap: 4.29B
Multiple Top
12/11/2025
Bearish pattern with three or more peaks at similar price levels, indicating strong resistance
Myungmoon Pharmaceutical Co. Ltd.
KR
Market Cap: 38.13M
Industry: Drug Manufacturers - Specialty & Generic
Multiple Top
12/11/2025
Bearish pattern with three or more peaks at similar price levels, indicating strong resistance
Trustmark Corp
US
Market Cap: 2.48B
Industry: Regionale Banken
Multiple Top
12/11/2025
Bearish pattern with three or more peaks at similar price levels, indicating strong resistance
Heritage Financial Corp
US
Market Cap: 819.71M
Industry: Banks - Regional
Multiple Top
12/11/2025
Bearish pattern with three or more peaks at similar price levels, indicating strong resistance
Colony Bankcorp Inc
US
Market Cap: 319.58M
Industry: Banks - Regional
Multiple Top
12/11/2025
Bearish pattern with three or more peaks at similar price levels, indicating strong resistance
Old National Bancorp
US
Market Cap: 8.71B
Industry: Banks - Regional
Multiple Top
12/11/2025
Bearish pattern with three or more peaks at similar price levels, indicating strong resistance
Biodyne Co. Ltd.
KR
Market Cap: 311.64M
Industry: Medical Instruments & Supplies
Multiple Top
12/11/2025
Bearish pattern with three or more peaks at similar price levels, indicating strong resistance
Profound Medical Corp
CA
Market Cap: 199.28M
Industry: Medical Devices
Multiple Top
12/11/2025
Bearish pattern with three or more peaks at similar price levels, indicating strong resistance
1st Source Corp
US
Market Cap: 1.61B
Industry: Banks - Regional
Multiple Top
12/11/2025
Bearish pattern with three or more peaks at similar price levels, indicating strong resistance
Want to see more technical patterns?
Access our full platform with advanced filtering, real-time alerts, and comprehensive market analysis.
View Full Platform →About Multiple Top Patterns
Multiple Top patterns are technical chart formations that traders and investors use to identify potential entry and exit points. These patterns are based on historical price movements and can help predict future price direction.
Understanding the Multiple Top in Stocks
What is the Multiple Top Pattern in Stocks?
The Multiple Top pattern is a bearish reversal pattern that appears at the end of an uptrend, indicating a potential downward movement. This pattern forms when the price of a stock hits a high multiple times before declining. It resembles the shape of several "M" formations on a price chart. In stock trading, the Multiple Top pattern is significant because it often marks the end of a bullish phase and the beginning of a bearish trend. Recognizing this pattern can help traders anticipate price movements and make strategic trades.
How to Identify Multiple Top Patterns
Identifying the Multiple Top pattern involves several key steps:
- Initial Uptrend: Look for a clear uptrend where the price reaches new highs.
- Multiple Tops: Observe the price hitting high points multiple times and declining to form lows.
- Confirmation: After the last top, the price should decline and break below the lows formed between the tops, confirming the pattern.
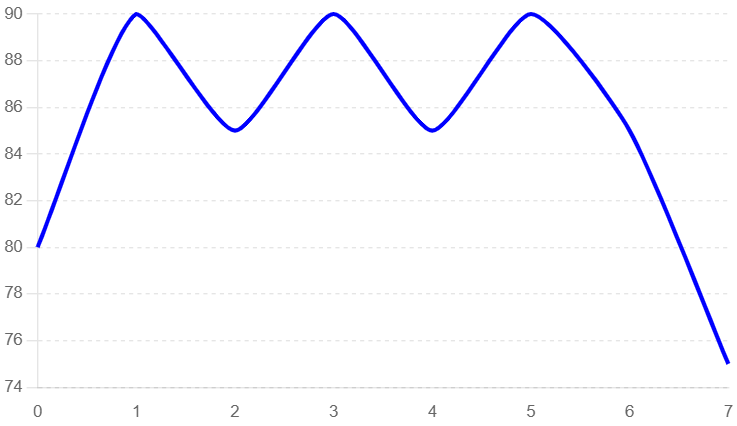
Identifying a Multiple Top Pattern
In this example, we use a typical candlestick chart to illustrate the formation of a Multiple Top pattern. Key elements to observe include the initial uptrend, the formation of the multiple tops, and the subsequent breakout.
- Initial Uptrend: The price of the stock shows a clear uptrend, indicating bullish market sentiment.
- Multiple Tops: The price hits high points (Points A, B, C, etc.) and then declines to form lows.
- Breakout Confirmation: After the final top, the price declines and breaks below the lows formed between the tops, confirming the pattern.
Multiple Top Pattern
Key Indicators
- Candlestick Patterns: Look for reversal candlestick patterns near the tops.
- Volume Spikes: Increased trading volume often accompanies the breakout, indicating strong selling interest.
- Resistance Levels: The tops should align with significant resistance levels on the chart.
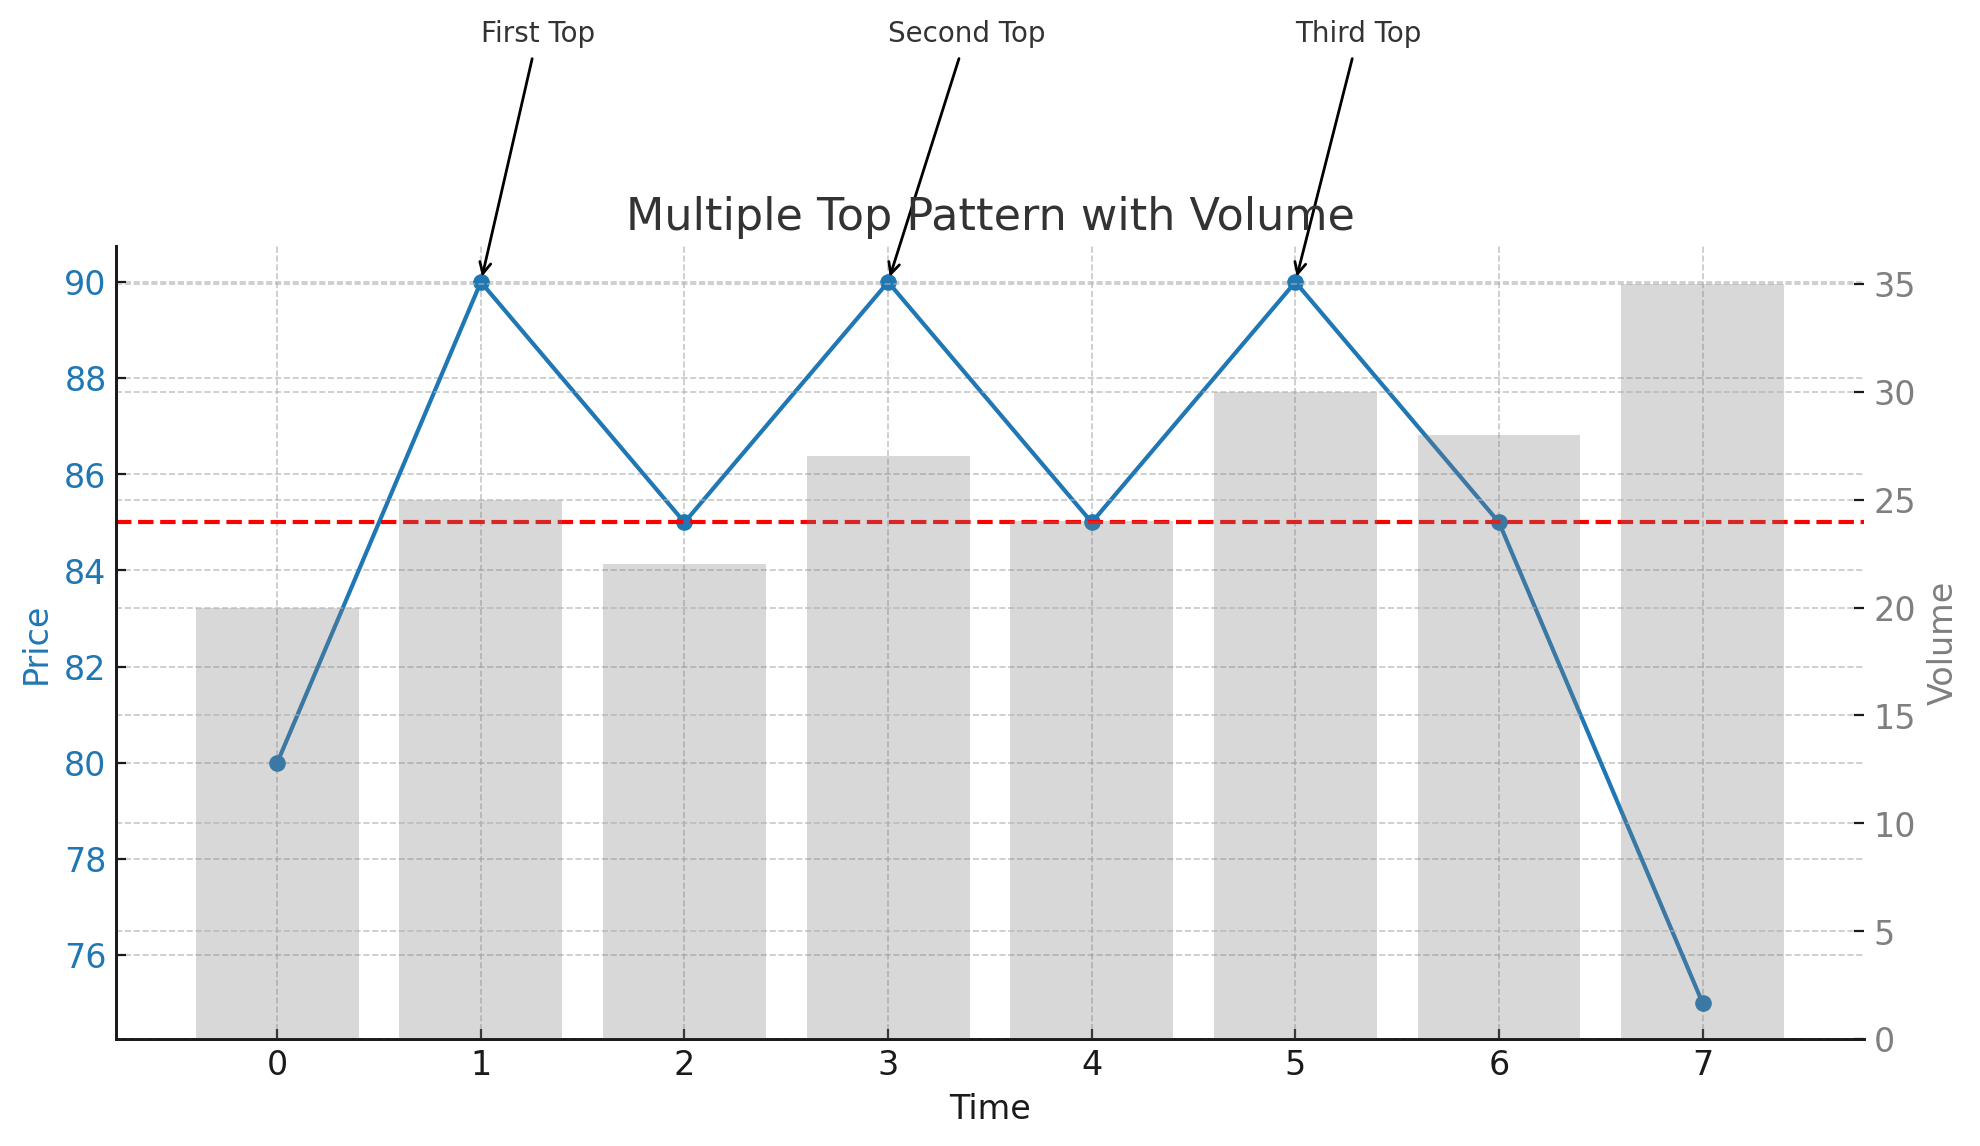
Multiple Top Pattern with Volume Analysis
This example highlights the role of volume in confirming the Multiple Top pattern. Volume analysis can provide additional confidence in the pattern's validity.
- Initial Uptrend: The price trend is upward, characterized by increasing prices and moderate volume.
- Multiple Tops: The price reaches high points with moderate volume as sellers begin to enter the market.
- Rebound to Lows: The price declines from each top, but volume remains moderate.
- Breakout Confirmation: The price declines and breaks below the lows formed between the tops, accompanied by a significant spike in volume, confirming the pattern.
Multiple Top Pattern with Volume
Frequently Asked Questions
What is the Multiple Top pattern in stock trading?
The Multiple Top pattern in stock trading is a bearish reversal pattern that appears at the end of an uptrend. It indicates a potential downward movement and is characterized by the price hitting a high point multiple times before declining.
How reliable is the Multiple Top pattern in stocks?
The Multiple Top pattern is considered a reliable bearish reversal signal in stock trading, especially when confirmed by increased trading volume and a strong breakout below the lows formed between the tops. However, it should be used alongside other technical analysis tools.
Can the Multiple Top pattern appear in any stock?
Yes, the Multiple Top pattern can appear in any stock. It is a widely applicable chart pattern used in technical analysis across various assets, including stocks.
What common mistakes should be avoided when trading the Multiple Top pattern?
Common mistakes include entering the trade too early before the breakout confirmation, not confirming the pattern with volume analysis, and failing to set appropriate stop-loss levels to manage risk. By understanding and utilizing the Multiple Top pattern, traders can better anticipate bearish reversals and optimize their trading strategies for improved outcomes in the stock market.
What are the key indicators to consider when trading the Multiple Top pattern in stocks?
Key indicators include identifying significant resistance levels, confirming the pattern with increased volume during the breakout, and observing reversal candlestick patterns near the tops. These indicators help validate the Multiple Top pattern and provide insights for potential significant price movements.