Multiple Bottom Technical Pattern
Learn about the Multiple Bottom pattern in stock trading - a bullish reversal pattern that signals potential upward movement. Understand how to identify and trade this technical analysis pattern effectively with volume analysis and key indicators.
Recent Multiple Bottom Patterns
15 patterns found
Yatsen Holding
CN
Market Cap: 529.24M
Industry: Household & Personal Products
Multiple Bottom
12/11/2025
Bullish pattern with three or more troughs at similar price levels, suggesting strong support
iHuman Inc.
CN
Market Cap: 129.39M
Industry: Education & Training Services
Multiple Bottom
12/11/2025
Bullish pattern with three or more troughs at similar price levels, suggesting strong support
Línea Directa Aseguradora, S.A.
ES
Market Cap: 1.46B
Industry: Insurance - Property & Casualty
Multiple Bottom
12/11/2025
Bullish pattern with three or more troughs at similar price levels, suggesting strong support
Castro Model Ltd.
IL
Market Cap: 393.79M
Industry: Apparel Retail
Multiple Bottom
12/11/2025
Bullish pattern with three or more troughs at similar price levels, suggesting strong support
SimFabric S.A.
PL
Market Cap: 2.96M
Industry: Electronic Gaming & Multimedia
Multiple Bottom
12/11/2025
Bullish pattern with three or more troughs at similar price levels, suggesting strong support
24SEVENOFFICE GROUP AB
SE
Market Cap: 72.15M
Industry: Software - Application
Multiple Bottom
12/11/2025
Bullish pattern with three or more troughs at similar price levels, suggesting strong support
Voxel S.A.
PL
Market Cap: 457.15M
Industry: Diagnostics & Research
Multiple Bottom
12/11/2025
Bullish pattern with three or more troughs at similar price levels, suggesting strong support
Telix Pharmaceuticals Ltd
AU
Market Cap: 3.30B
Industry: Biotechnology
Multiple Bottom
12/11/2025
Bullish pattern with three or more troughs at similar price levels, suggesting strong support
LOVESAC CO
US
Market Cap: 204.11M
Industry: Furnishings, Fixtures & Appliances
Multiple Bottom
12/11/2025
Bullish pattern with three or more troughs at similar price levels, suggesting strong support
LENDLEASE GROUP
AU
Market Cap: 2.35B
Industry: Real Estate - Diversified
Multiple Bottom
12/11/2025
Bullish pattern with three or more troughs at similar price levels, suggesting strong support
K-Fast Holding AB
SE
Market Cap: 339.76M
Industry: Residential Construction
Multiple Bottom
12/11/2025
Bullish pattern with three or more troughs at similar price levels, suggesting strong support
Daelim Trading Co. Ltd.
KR
Market Cap: 23.13M
Industry: Household & Personal Products
Multiple Bottom
12/11/2025
Bullish pattern with three or more troughs at similar price levels, suggesting strong support
Zhihu Inc.
CN
Market Cap: 267.44M
Industry: Internet Content & Information
Multiple Bottom
12/11/2025
Bullish pattern with three or more troughs at similar price levels, suggesting strong support
Adecco Group AG
CH
Market Cap: 4.85B
Multiple Bottom
12/11/2025
Bullish pattern with three or more troughs at similar price levels, suggesting strong support
Chocoladefabriken Lindt & Sprüngli AG
CH
Market Cap: 3.68B
Multiple Bottom
12/11/2025
Bullish pattern with three or more troughs at similar price levels, suggesting strong support
Want to see more technical patterns?
Access our full platform with advanced filtering, real-time alerts, and comprehensive market analysis.
View Full Platform →About Multiple Bottom Patterns
Multiple Bottom patterns are technical chart formations that traders and investors use to identify potential entry and exit points. These patterns are based on historical price movements and can help predict future price direction.
Understanding the Multiple Bottom in Stocks
What is the Multiple Bottom Pattern in Stocks?
The Multiple Bottom pattern is a bullish reversal pattern that appears at the end of a downtrend, indicating a potential upward movement. This pattern forms when the price of a stock hits a low multiple times before rising again. It resembles the shape of several "W" formations on a price chart. In stock trading, the Multiple Bottom pattern is significant because it often marks the end of a bearish phase and the beginning of a bullish trend. Recognizing this pattern can help traders anticipate price movements and make strategic trades.
How to Identify Multiple Bottom Patterns
Identifying the Multiple Bottom pattern involves several key steps:
- Initial Decline: Look for a clear downtrend where the price reaches new lows.
- Multiple Bottoms: Observe the price hitting low points multiple times and rebounding to form peaks.
- Confirmation: After the last bottom, the price should rise and break above the peaks formed between the bottoms, confirming the pattern.
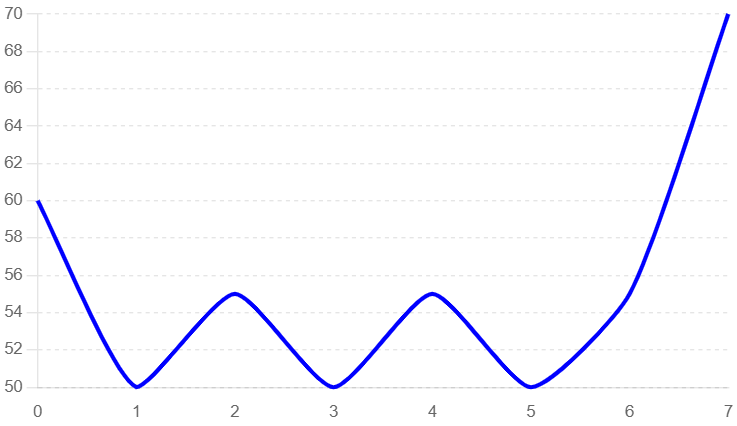
Identifying a Multiple Bottom Pattern
In this example, we use a typical candlestick chart to illustrate the formation of a Multiple Bottom pattern. Key elements to observe include the initial decline, the formation of the multiple bottoms, and the subsequent breakout.
- Initial Decline: The price of the stock shows a clear downtrend, indicating bearish market sentiment.
- Multiple Bottoms: The price hits low points (Points A, B, C, etc.) and then rebounds to form peaks.
- Breakout Confirmation: After the final bottom, the price rises and breaks above the peaks formed between the bottoms, confirming the pattern.
Multiple Bottom Pattern
Key Indicators
- Candlestick Patterns: Look for reversal candlestick patterns near the bottoms.
- Volume Spikes: Increased trading volume often accompanies the breakout, indicating strong buying interest.
- Support Levels: The bottoms should align with significant support levels on the chart.
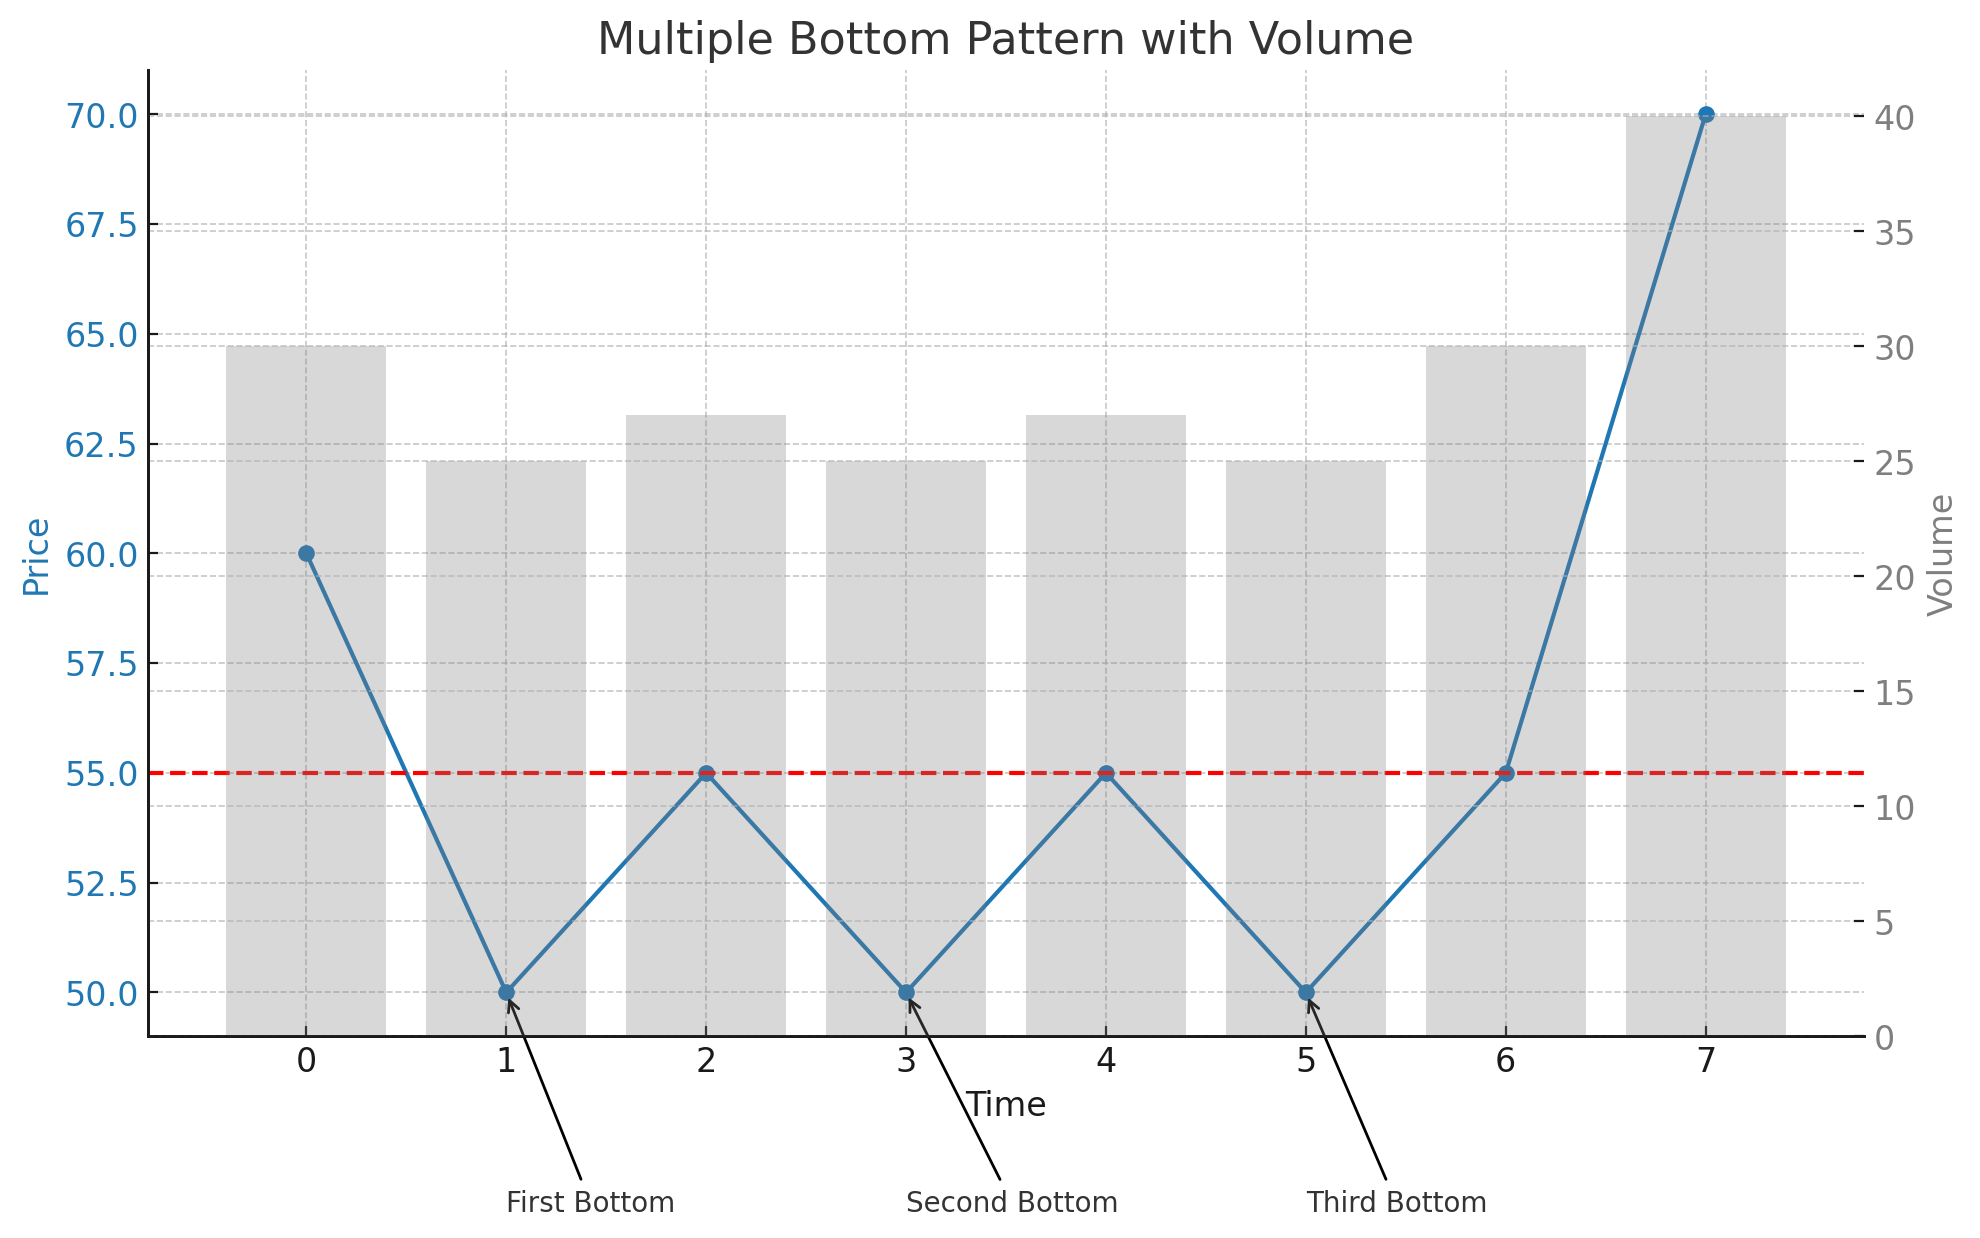
Multiple Bottom Pattern with Volume Analysis
This example highlights the role of volume in confirming the Multiple Bottom pattern. Volume analysis can provide additional confidence in the pattern's validity.
- Initial Decline: The price trend is downward, characterized by decreasing prices and relatively low volume.
- Multiple Bottoms: The price reaches low points with moderate volume as buyers begin to enter the market.
- Rebound to Peaks: The price rises from each bottom, but volume remains moderate.
- Breakout Confirmation: The price breaks above the peaks formed between the bottoms, accompanied by a significant spike in volume, confirming the pattern.
Multiple Bottom Pattern with Volume
Frequently Asked Questions
What is the Multiple Bottom pattern in stock trading?
The Multiple Bottom pattern in stock trading is a bullish reversal pattern that appears at the end of a downtrend. It indicates a potential upward movement and is characterized by the price hitting a low point multiple times before rising again.
How reliable is the Multiple Bottom pattern in stocks?
The Multiple Bottom pattern is considered a reliable bullish reversal signal in stock trading, especially when confirmed by increased trading volume and a strong breakout above the peaks formed between the bottoms. However, it should be used alongside other technical analysis tools.
Can the Multiple Bottom pattern appear in any stock?
Yes, the Multiple Bottom pattern can appear in any stock. It is a widely applicable chart pattern used in technical analysis across various assets, including stocks.
What common mistakes should be avoided when trading the Multiple Bottom pattern?
Common mistakes include entering the trade too early before the breakout confirmation, not confirming the pattern with volume analysis, and failing to set appropriate stop-loss levels to manage risk. By understanding and utilizing the Multiple Bottom pattern, traders can better anticipate bullish reversals and optimize their trading strategies for improved outcomes in the stock market.
What are the key indicators to consider when trading the Multiple Bottom pattern in stocks?
Key indicators include identifying significant support levels, confirming the pattern with increased volume during the breakout, and observing reversal candlestick patterns near the bottoms. These indicators help validate the Multiple Bottom pattern and provide insights for potential significant price movements.