Head & Shoulders Technical Pattern
Learn about the Bullish Head-and-Shoulders pattern in stock trading - a reversal pattern that signals potential upward movement. Understand how to identify and trade this technical analysis pattern effectively with volume analysis and key indicators.
Recent Head & Shoulders Patterns
15 patterns found
Netanel Group Ltd
IL
Market Cap: 113.22M
Industry: Real Estate Services
Head & Shoulders
12/14/2025
Bearish reversal pattern with three peaks, the middle being highest, often signaling a trend change from bullish to bearish
Intelligent Protection Management Corp.
US
Market Cap: 24.47M
Industry: Software - Application
Head & Shoulders
12/12/2025
Bearish reversal pattern with three peaks, the middle being highest, often signaling a trend change from bullish to bearish
Nick Scali Ltd
AU
Market Cap: 1.23B
Industry: Specialty Retail
Head & Shoulders
12/12/2025
Bearish reversal pattern with three peaks, the middle being highest, often signaling a trend change from bullish to bearish
TH International Limited
CN
Market Cap: 85.79M
Industry: Restaurants
Head & Shoulders
12/12/2025
Bearish reversal pattern with three peaks, the middle being highest, often signaling a trend change from bullish to bearish
Datadog Inc
US
Market Cap: 53.10B
Industry: Software - Application
Head & Shoulders
12/12/2025
Bearish reversal pattern with three peaks, the middle being highest, often signaling a trend change from bullish to bearish
Dongwon Industries Co. Ltd.
KR
Market Cap: 1.28B
Industry: Food Distribution
Head & Shoulders
12/10/2025
Bearish reversal pattern with three peaks, the middle being highest, often signaling a trend change from bullish to bearish
Anebulo Pharmaceuticals Inc
US
Market Cap: 92.85M
Industry: Biotechnology
Head & Shoulders
12/10/2025
Bearish reversal pattern with three peaks, the middle being highest, often signaling a trend change from bullish to bearish
Daelim Trading Co. Ltd.
KR
Market Cap: 24.50M
Industry: Household & Personal Products
Head & Shoulders
12/9/2025
Bearish reversal pattern with three peaks, the middle being highest, often signaling a trend change from bullish to bearish
3R Games S.A.
PL
Market Cap: 44.43M
Industry: Software & IT Services
Head & Shoulders
12/9/2025
Bearish reversal pattern with three peaks, the middle being highest, often signaling a trend change from bullish to bearish
RSL Electronics Ltd
IL
Market Cap: 1.56B
Industry: Aerospace & Defense
Head & Shoulders
12/9/2025
Bearish reversal pattern with three peaks, the middle being highest, often signaling a trend change from bullish to bearish
CytoMed Therapeutics Limited
SG
Market Cap: 21.85M
Industry: Biotechnology
Head & Shoulders
12/9/2025
Bearish reversal pattern with three peaks, the middle being highest, often signaling a trend change from bullish to bearish
Inter & Co, Inc.
BR
Market Cap: 3.63B
Industry: Banks - Regional
Head & Shoulders
12/8/2025
Bearish reversal pattern with three peaks, the middle being highest, often signaling a trend change from bullish to bearish
CVR Energy Inc
US
Market Cap: 3.28B
Industry: Oil & Gas Refining & Marketing
Head & Shoulders
12/8/2025
Bearish reversal pattern with three peaks, the middle being highest, often signaling a trend change from bullish to bearish
EcoGraf Ltd
AU
Market Cap: 130.11M
Industry: Other Industrial Metals & Mining
Head & Shoulders
12/8/2025
Bearish reversal pattern with three peaks, the middle being highest, often signaling a trend change from bullish to bearish
PBF Energy Inc
US
Market Cap: 3.87B
Industry: Oil & Gas Refining & Marketing
Head & Shoulders
12/8/2025
Bearish reversal pattern with three peaks, the middle being highest, often signaling a trend change from bullish to bearish
Want to see more technical patterns?
Access our full platform with advanced filtering, real-time alerts, and comprehensive market analysis.
View Full Platform →About Head & Shoulders Patterns
Head & Shoulders patterns are technical chart formations that traders and investors use to identify potential entry and exit points. These patterns are based on historical price movements and can help predict future price direction.
Understanding the Bullish Head-and-Shoulders in Stocks
What is the Bullish Head-and-Shoulders Pattern in Stocks?
The Bullish Head-and-Shoulders pattern is a reversal pattern that appears at the end of a downtrend, indicating a potential upward movement. This pattern forms when the price of a stock creates three successive troughs, with the middle trough (head) being the lowest, flanked by two higher troughs (shoulders). In stock trading, the Bullish Head-and-Shoulders pattern is significant because it often marks the end of a bearish phase and the beginning of a bullish trend. Recognizing this pattern can help traders anticipate price movements and make strategic trades.
How to Identify Bullish Head-and-Shoulders Patterns
Identifying the Bullish Head-and-Shoulders pattern involves several key steps:
- Initial Downtrend: Look for a clear downtrend where the price reaches new lows.
- Left Shoulder: The price hits a low point, rises, and then falls again.
- Head: The price forms a lower low than the left shoulder and rises again.
- Right Shoulder: The price forms a higher low, similar to the left shoulder, and then rises.
- Neckline Breakout: The price breaks above the neckline, confirming the pattern.
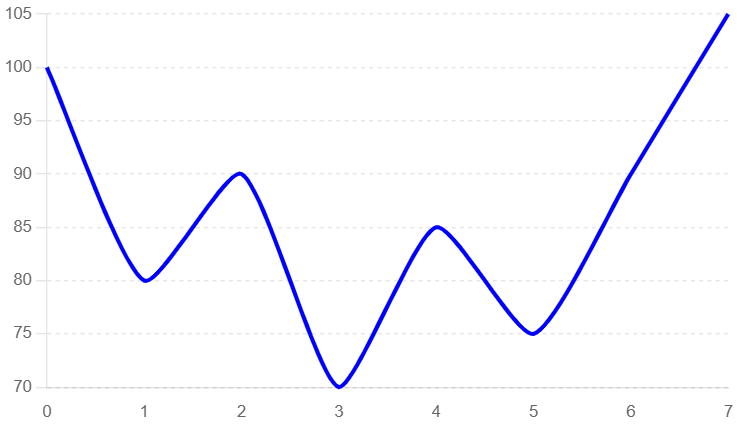
Identifying a Bullish Head-and-Shoulders Pattern
In this example, we use a typical candlestick chart to illustrate the formation of a Bullish Head-and-Shoulders pattern. Key elements to observe include the initial downtrend, the formation of the left shoulder, head, and right shoulder, and the subsequent breakout.
- Initial Downtrend: The price of the stock shows a clear downtrend, indicating bearish market sentiment.
- Left Shoulder: The price hits a low point and then rises.
- Head: The price forms a lower low and then rises.
- Right Shoulder: The price forms a higher low, similar to the left shoulder, and then rises.
- Breakout Confirmation: The price breaks above the neckline, confirming the pattern.
Bullish Head-and-Shoulders Pattern
Key Indicators
- Candlestick Patterns: Look for reversal candlestick patterns near the shoulders.
- Volume Spikes: Increased trading volume often accompanies the breakout, indicating strong buying interest.
- Support Levels: The shoulders should align with significant support levels on the chart.
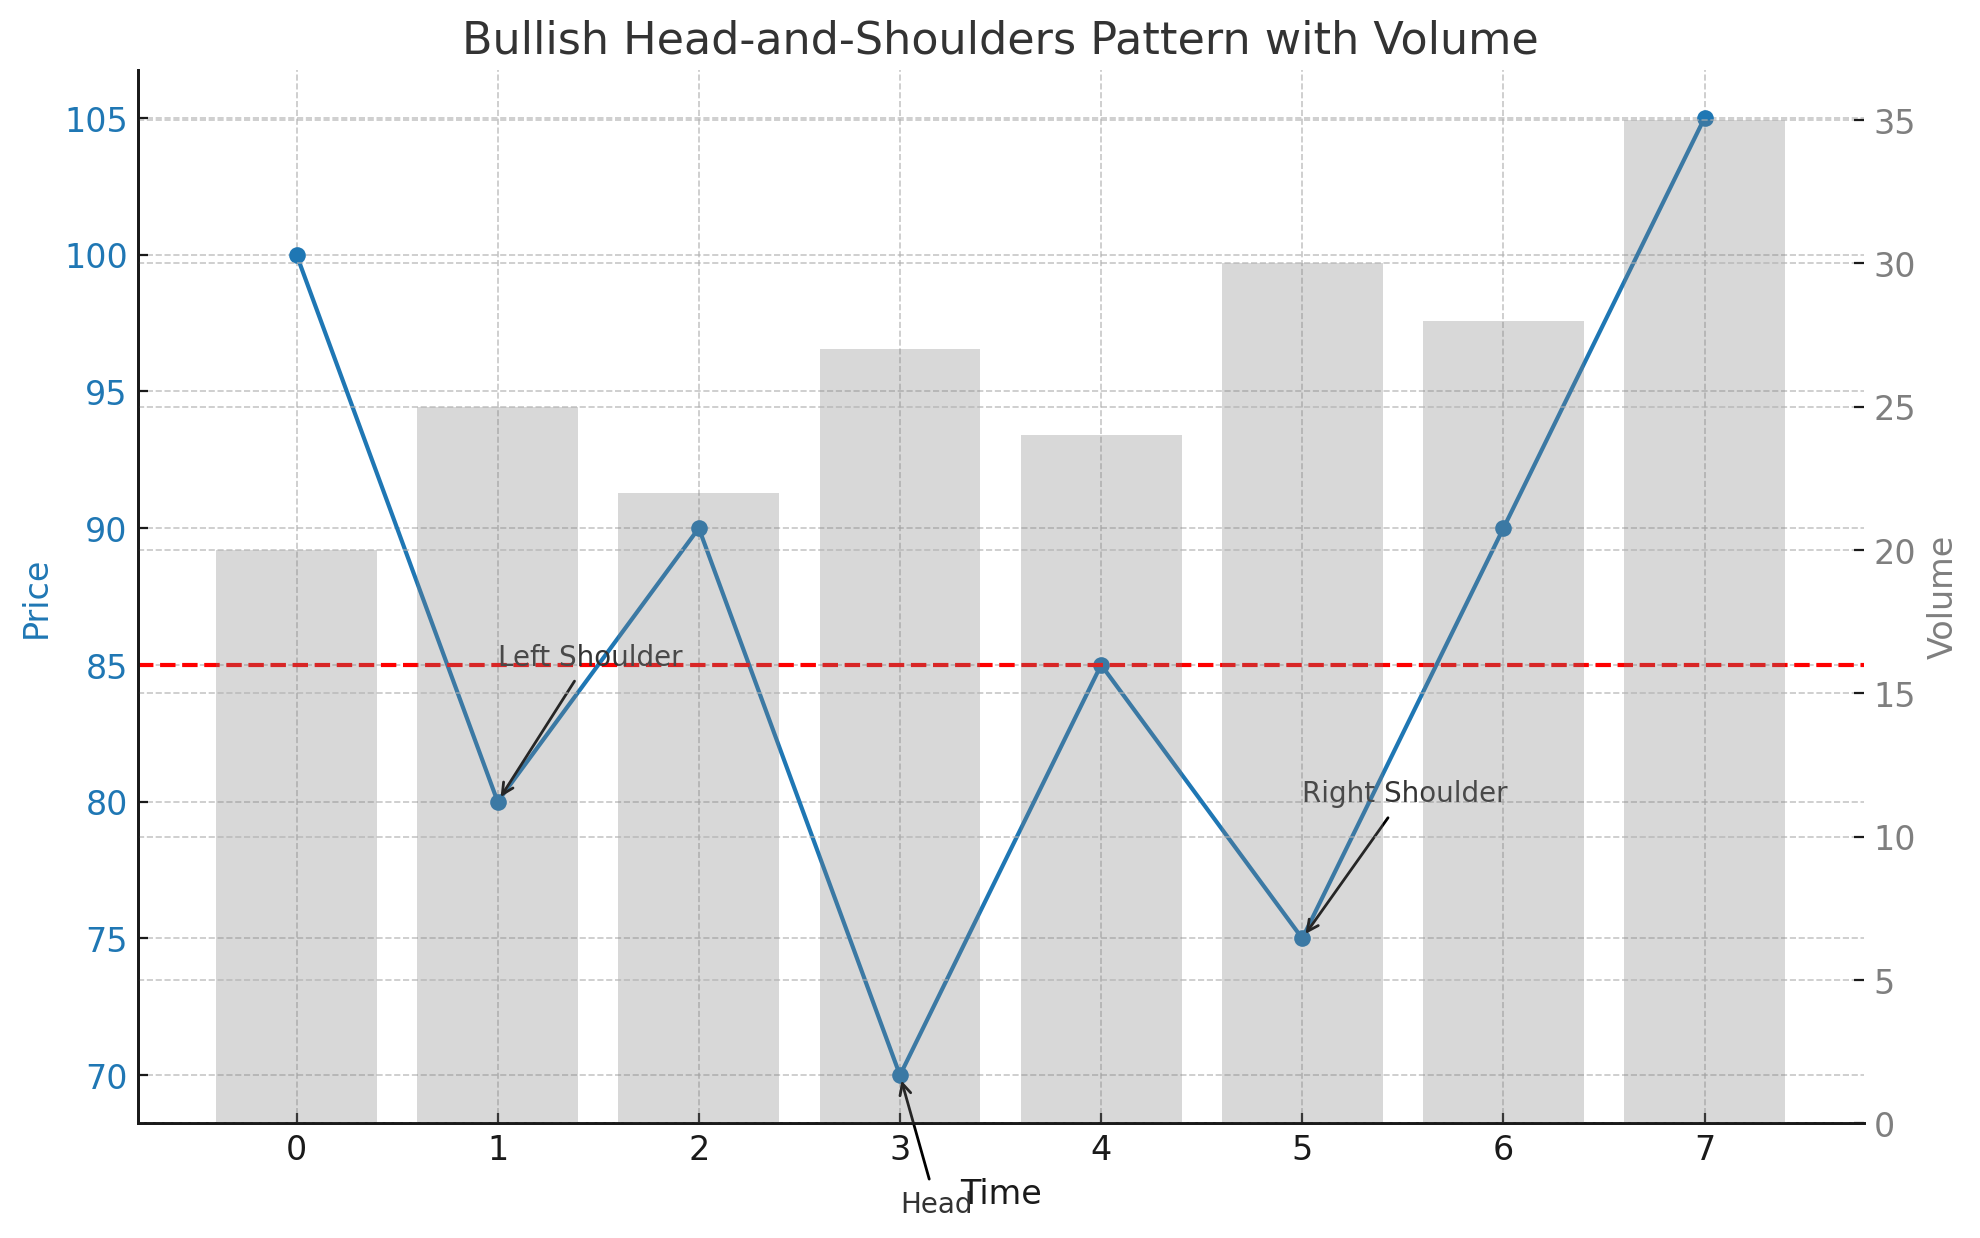
Bullish Head-and-Shoulders Pattern with Volume Analysis
This example highlights the role of volume in confirming the Bullish Head-and-Shoulders pattern. Volume analysis can provide additional confidence in the pattern's validity.
- Initial Downtrend: The price trend is downward, characterized by decreasing prices and moderate volume.
- Left Shoulder: The price hits a low point with moderate volume as buyers begin to enter the market.
- Head: The price forms a lower low with moderate volume and then rises.
- Right Shoulder: The price forms a higher low with moderate volume and then rises.
- Breakout: The price breaks above the neckline with a significant spike in volume, confirming the pattern.
Bullish Head-and-Shoulders Pattern with Volume
Frequently Asked Questions
What is the Bullish Head-and-Shoulders pattern in stock trading?
The Bullish Head-and-Shoulders pattern in stock trading is a reversal pattern that appears at the end of a downtrend. It indicates a potential upward movement and is characterized by the price forming three successive troughs, with the middle trough being the lowest, flanked by two higher troughs.
How reliable is the Bullish Head-and-Shoulders pattern in stocks?
The Bullish Head-and-Shoulders pattern is considered a reliable bullish reversal signal in stock trading, especially when confirmed by increased trading volume and a strong breakout above the neckline. However, it should be used alongside other technical analysis tools.
Can the Bullish Head-and-Shoulders pattern appear in any stock?
Yes, the Bullish Head-and-Shoulders pattern can appear in any stock. It is a widely applicable chart pattern used in technical analysis across various assets, including stocks.
What common mistakes should be avoided when trading the Bullish Head-and-Shoulders pattern?
Common mistakes include entering the trade too early before the neckline breakout confirmation, not confirming the pattern with volume analysis, and failing to set appropriate stop-loss levels to manage risk. By understanding and utilizing the Bullish Head-and-Shoulders pattern, traders can better anticipate bullish reversals and optimize their trading strategies for improved outcomes in the stock market.
What are the key indicators to consider when trading the Bullish Head-and-Shoulders pattern in stocks?
Key indicators include identifying significant support levels, confirming the pattern with increased volume during the breakout, and observing reversal candlestick patterns near the shoulders. These indicators help validate the Bullish Head-and-Shoulders pattern and provide insights for potential significant price movements.