Descending Triangle BreakOut Technical Pattern
Learn about the Triangle Bullish Breakout pattern in stock trading - a continuation pattern that signals potential upward movement. Understand how to identify and trade this technical analysis pattern effectively with volume analysis and key indicators.
Recent Descending Triangle BreakOut Patterns
15 patterns found
ARLANDASTAD GROUP AB
SE
Market Cap: 218.96M
Industry: Immobilienentwicklung
Descending Triangle BreakOut
12/11/2025
Bullish pattern often leading to a trend reversal
SYNACT PHARMA AB
SE
Market Cap: 121.87M
Industry: Biotechnology
Descending Triangle BreakOut
12/11/2025
Bullish pattern often leading to a trend reversal
Envista Holdings Corp
US
Market Cap: 3.33B
Industry: Medical Instruments & Supplies
Descending Triangle BreakOut
12/10/2025
Bullish pattern often leading to a trend reversal
Greene County Bancorp Inc
US
Market Cap: 390.59M
Industry: Banks - Regional
Descending Triangle BreakOut
12/10/2025
Bullish pattern often leading to a trend reversal
BIO-Key International Inc
US
Market Cap: 8.29M
Industry: Security & Protection Services
Descending Triangle BreakOut
12/10/2025
Bullish pattern often leading to a trend reversal
Grace Therapeutics, Inc.
US
Market Cap: 49.83M
Industry: Biotechnology
Descending Triangle BreakOut
12/9/2025
Bullish pattern often leading to a trend reversal
KLARIA PHARMA HOLDING AB
SE
Market Cap: 14.13M
Industry: Drug Manufacturers - Specialty & Generic
Descending Triangle BreakOut
12/8/2025
Bullish pattern often leading to a trend reversal
MDJM Ltd
GB
Market Cap: 2.81M
Industry: Lodging
Descending Triangle BreakOut
12/8/2025
Bullish pattern often leading to a trend reversal
Fenbo Holdings Limited Ordinary Shares
HK
Market Cap: 7.92M
Industry: Consumer Electronics
Descending Triangle BreakOut
12/8/2025
Bullish pattern often leading to a trend reversal
reAlpha Tech Corp. Common Stock
US
Market Cap: 68.43M
Industry: Real Estate Services
Descending Triangle BreakOut
12/8/2025
Bullish pattern often leading to a trend reversal
Riber S.A
FR
Market Cap: 78.37M
Industry: Semiconductor Equipment & Materials
Descending Triangle BreakOut
12/4/2025
Bullish pattern often leading to a trend reversal
Viromed Medical AG
DE
Market Cap: 1.93B
Industry: Medical Devices
Descending Triangle BreakOut
12/4/2025
Bullish pattern often leading to a trend reversal
REE Automotive Ltd.
IL
Market Cap: 25.55M
Industry: Auto Parts
Descending Triangle BreakOut
12/4/2025
Bullish pattern often leading to a trend reversal
Castor Maritime Inc
CY
Market Cap: 110.64M
Industry: Marine Shipping
Descending Triangle BreakOut
12/3/2025
Bullish pattern often leading to a trend reversal
Datalogic
IT
Market Cap: 302.61M
Descending Triangle BreakOut
12/3/2025
Bullish pattern often leading to a trend reversal
Want to see more technical patterns?
Access our full platform with advanced filtering, real-time alerts, and comprehensive market analysis.
View Full Platform →About Descending Triangle BreakOut Patterns
Descending Triangle BreakOut patterns are technical chart formations that traders and investors use to identify potential entry and exit points. These patterns are based on historical price movements and can help predict future price direction.
Understanding the Triangle Bullish Breakout in Stocks
What is the Triangle Bullish Breakout Pattern in Stocks?
The Triangle Bullish Breakout pattern is a continuation pattern that appears during an uptrend, indicating a potential continuation of the upward movement. This pattern forms when the price of a stock consolidates within converging trendlines, creating a triangular shape, before breaking out to the upside. In stock trading, the Triangle Bullish Breakout pattern is significant because it often signals the continuation of a bullish trend. Recognizing this pattern can help traders anticipate price movements and make strategic trades.
How to Identify Triangle Bullish Breakout Patterns
Identifying the Triangle Bullish Breakout pattern involves several key steps:
- Uptrend: Look for a clear uptrend leading into the pattern.
- Consolidation: The price consolidates within converging trendlines, forming a triangle.
- Breakout: The price breaks above the upper trendline, confirming the pattern.
Identifying a Triangle Bullish Breakout Pattern
In this example, we use a typical candlestick chart to illustrate the formation of a Triangle Bullish Breakout pattern. Key elements to observe include the uptrend, the consolidation phase, and the subsequent breakout.
- Uptrend: The price of the stock shows a clear upward trend leading into the pattern.
- Consolidation: The price consolidates within converging trendlines, forming a triangle.
- Breakout Confirmation: The price breaks above the upper trendline, confirming the pattern.
Triangle Bullish Breakout Pattern
Key Indicators
- Volume Spikes: Increased trading volume often accompanies the breakout, indicating strong buying interest.
- Trendlines: Converging trendlines forming the triangle.
- Candlestick Patterns: Look for bullish candlestick patterns near the breakout point.
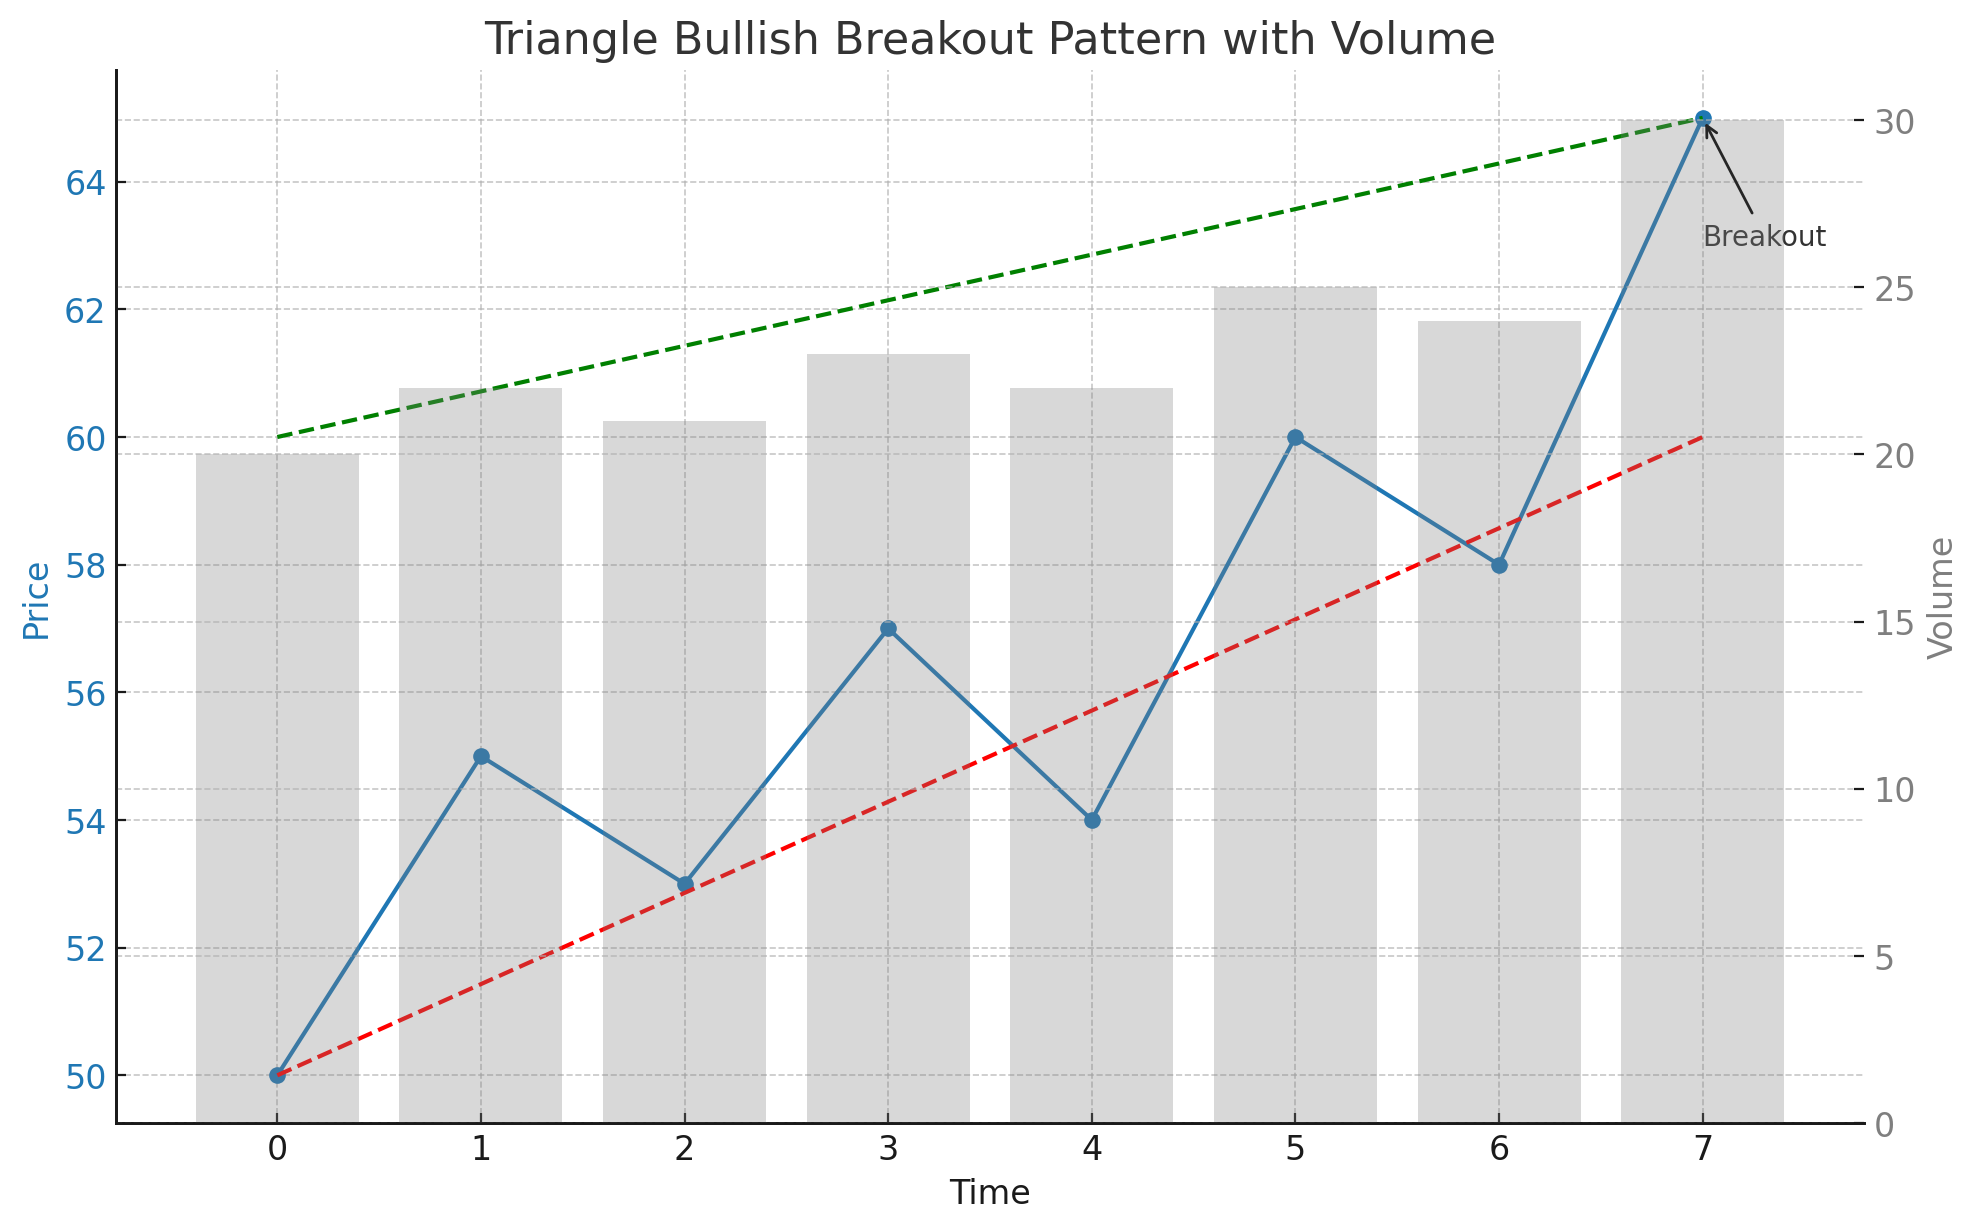
Triangle Bullish Breakout Pattern with Volume Analysis
This example highlights the role of volume in confirming the Triangle Bullish Breakout pattern. Volume analysis can provide additional confidence in the pattern's validity.
- Uptrend: The price trend is upward, characterized by increasing prices and moderate volume.
- Consolidation: The price consolidates within converging trendlines with moderate volume.
- Breakout: The price breaks above the upper trendline with a significant spike in volume, confirming the pattern.
Triangle Bullish Breakout Pattern with Volume

Frequently Asked Questions
What is the Triangle Bullish Breakout pattern in stock trading?
The Triangle Bullish Breakout pattern in stock trading is a continuation pattern that appears during an uptrend. It indicates a potential continuation of the upward movement and is characterized by the price consolidating within converging trendlines before breaking out to the upside.
How reliable is the Triangle Bullish Breakout pattern in stocks?
The Triangle Bullish Breakout pattern is considered a reliable bullish continuation signal in stock trading, especially when confirmed by increased trading volume and a strong breakout above the upper trendline. However, it should be used alongside other technical analysis tools.
Can the Triangle Bullish Breakout pattern appear in any stock?
Yes, the Triangle Bullish Breakout pattern can appear in any stock. It is a widely applicable chart pattern used in technical analysis across various assets, including stocks.
What common mistakes should be avoided when trading the Triangle Bullish Breakout pattern?
Common mistakes include entering the trade too early before the breakout confirmation, not confirming the pattern with volume analysis, and failing to set appropriate stop-loss levels to manage risk. By understanding and utilizing the Triangle Bullish Breakout pattern, traders can better anticipate bullish continuations and optimize their trading strategies for improved outcomes in the stock market.
What are the key indicators to consider when trading the Triangle Bullish Breakout pattern in stocks?
Key indicators include identifying significant trendlines, confirming the pattern with increased volume during the breakout, and observing bullish candlestick patterns near the breakout point. These indicators help validate the Triangle Bullish Breakout pattern and provide insights for potential significant price movements.