Descending Triangle BreakDown Technical Pattern
Learn about the Triangle Bearish Breakout pattern in stock trading - a continuation pattern that signals potential downward movement. Understand how to identify and trade this technical analysis pattern effectively with volume analysis and key indicators.
Recent Descending Triangle BreakDown Patterns
15 patterns found
Future Care Trading Co.
SA
Market Cap: 281.33M
Industry: Medical Care Facilities
Descending Triangle BreakDown
12/11/2025
Bearish pattern often leading to continuing downtrend
Chalice Mining Ltd
AU
Market Cap: 428.70M
Industry: Other Industrial Metals & Mining
Descending Triangle BreakDown
12/9/2025
Bearish pattern often leading to continuing downtrend
Kaival Brands Innovations Group Inc
US
Market Cap: 4.62M
Industry: Tobacco
Descending Triangle BreakDown
12/9/2025
Bearish pattern often leading to continuing downtrend
WIHLBORGS FASTIGHE. O.N.
SE
Market Cap: 3.35B
Industry: Real Estate Services
Descending Triangle BreakDown
12/9/2025
Bearish pattern often leading to continuing downtrend
iHuman Inc.
CN
Market Cap: 27.38M
Industry: Education & Training Services
Descending Triangle BreakDown
12/5/2025
Bearish pattern often leading to continuing downtrend
Foresight Autonomous Holdings Ltd
IL
Market Cap: 6.38M
Industry: Auto Parts
Descending Triangle BreakDown
12/4/2025
Bearish pattern often leading to continuing downtrend
Amoeba SA
FR
Market Cap: 52.20M
Industry: Agricultural Inputs
Descending Triangle BreakDown
12/3/2025
Bearish pattern often leading to continuing downtrend
Lee Enterprises Inc
US
Market Cap: 24.73M
Industry: Publishing
Descending Triangle BreakDown
12/3/2025
Bearish pattern often leading to continuing downtrend
Nama Chemicals Co.
SA
Market Cap: 156.11M
Industry: Chemicals
Descending Triangle BreakDown
12/2/2025
Bearish pattern often leading to continuing downtrend
Saudi Arabian Cooperative Insurance
SA
Market Cap: 106.72M
Industry: Insurance - Diversified
Descending Triangle BreakDown
12/1/2025
Bearish pattern often leading to continuing downtrend
Salama Cooperative Insurance Co
SA
Market Cap: 91.92M
Industry: Insurance - Property & Casualty
Descending Triangle BreakDown
11/27/2025
Bearish pattern often leading to continuing downtrend
AMADEUS FIRE AG
DE
Market Cap: 518.95M
Industry: Staffing & Employment Services
Descending Triangle BreakDown
11/27/2025
Bearish pattern often leading to continuing downtrend
fuboTV Inc.
US
Market Cap: 1.08B
Industry: Broadcasting
Descending Triangle BreakDown
11/24/2025
Bearish pattern often leading to continuing downtrend
Huddlestock Fintech As
NO
Market Cap: 7.10M
Industry: Software - Application
Descending Triangle BreakDown
11/21/2025
Bearish pattern often leading to continuing downtrend
NORTH ENERGY
NO
Market Cap: 30.18M
Industry: Asset Management
Descending Triangle BreakDown
11/20/2025
Bearish pattern often leading to continuing downtrend
Want to see more technical patterns?
Access our full platform with advanced filtering, real-time alerts, and comprehensive market analysis.
View Full Platform →About Descending Triangle BreakDown Patterns
Descending Triangle BreakDown patterns are technical chart formations that traders and investors use to identify potential entry and exit points. These patterns are based on historical price movements and can help predict future price direction.
Understanding the Triangle Bearish Breakout in Stocks
What is the Triangle Bearish Breakout Pattern in Stocks?
The Triangle Bearish Breakout pattern is a continuation pattern that appears during a downtrend, indicating a potential continuation of the downward movement. This pattern forms when the price of a stock consolidates within converging trendlines, creating a triangular shape, before breaking out to the downside. In stock trading, the Triangle Bearish Breakout pattern is significant because it often signals the continuation of a bearish trend. Recognizing this pattern can help traders anticipate price movements and make strategic trades.
How to Identify Triangle Bearish Breakout Patterns
Identifying the Triangle Bearish Breakout pattern involves several key steps:
- Downtrend: Look for a clear downtrend leading into the pattern.
- Consolidation: The price consolidates within converging trendlines, forming a triangle.
- Breakout: The price breaks below the lower trendline, confirming the pattern.
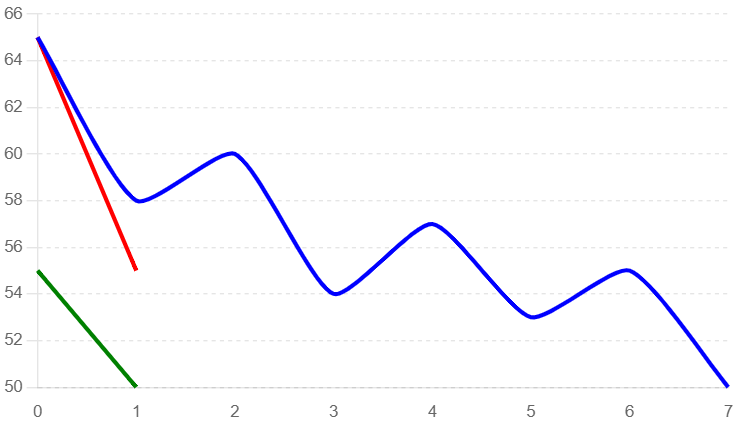
Identifying a Triangle Bearish Breakout Pattern
In this example, we use a typical candlestick chart to illustrate the formation of a Triangle Bearish Breakout pattern. Key elements to observe include the downtrend, the consolidation phase, and the subsequent breakout.
- Downtrend: The price of the stock shows a clear downward trend leading into the pattern.
- Consolidation: The price consolidates within converging trendlines, forming a triangle.
- Breakout Confirmation: The price breaks below the lower trendline, confirming the pattern.
Triangle Bearish Breakout Pattern
Key Indicators
- Volume Spikes: Increased trading volume often accompanies the breakout, indicating strong selling interest.
- Trendlines: Converging trendlines forming the triangle.
- Candlestick Patterns: Look for bearish candlestick patterns near the breakout point.
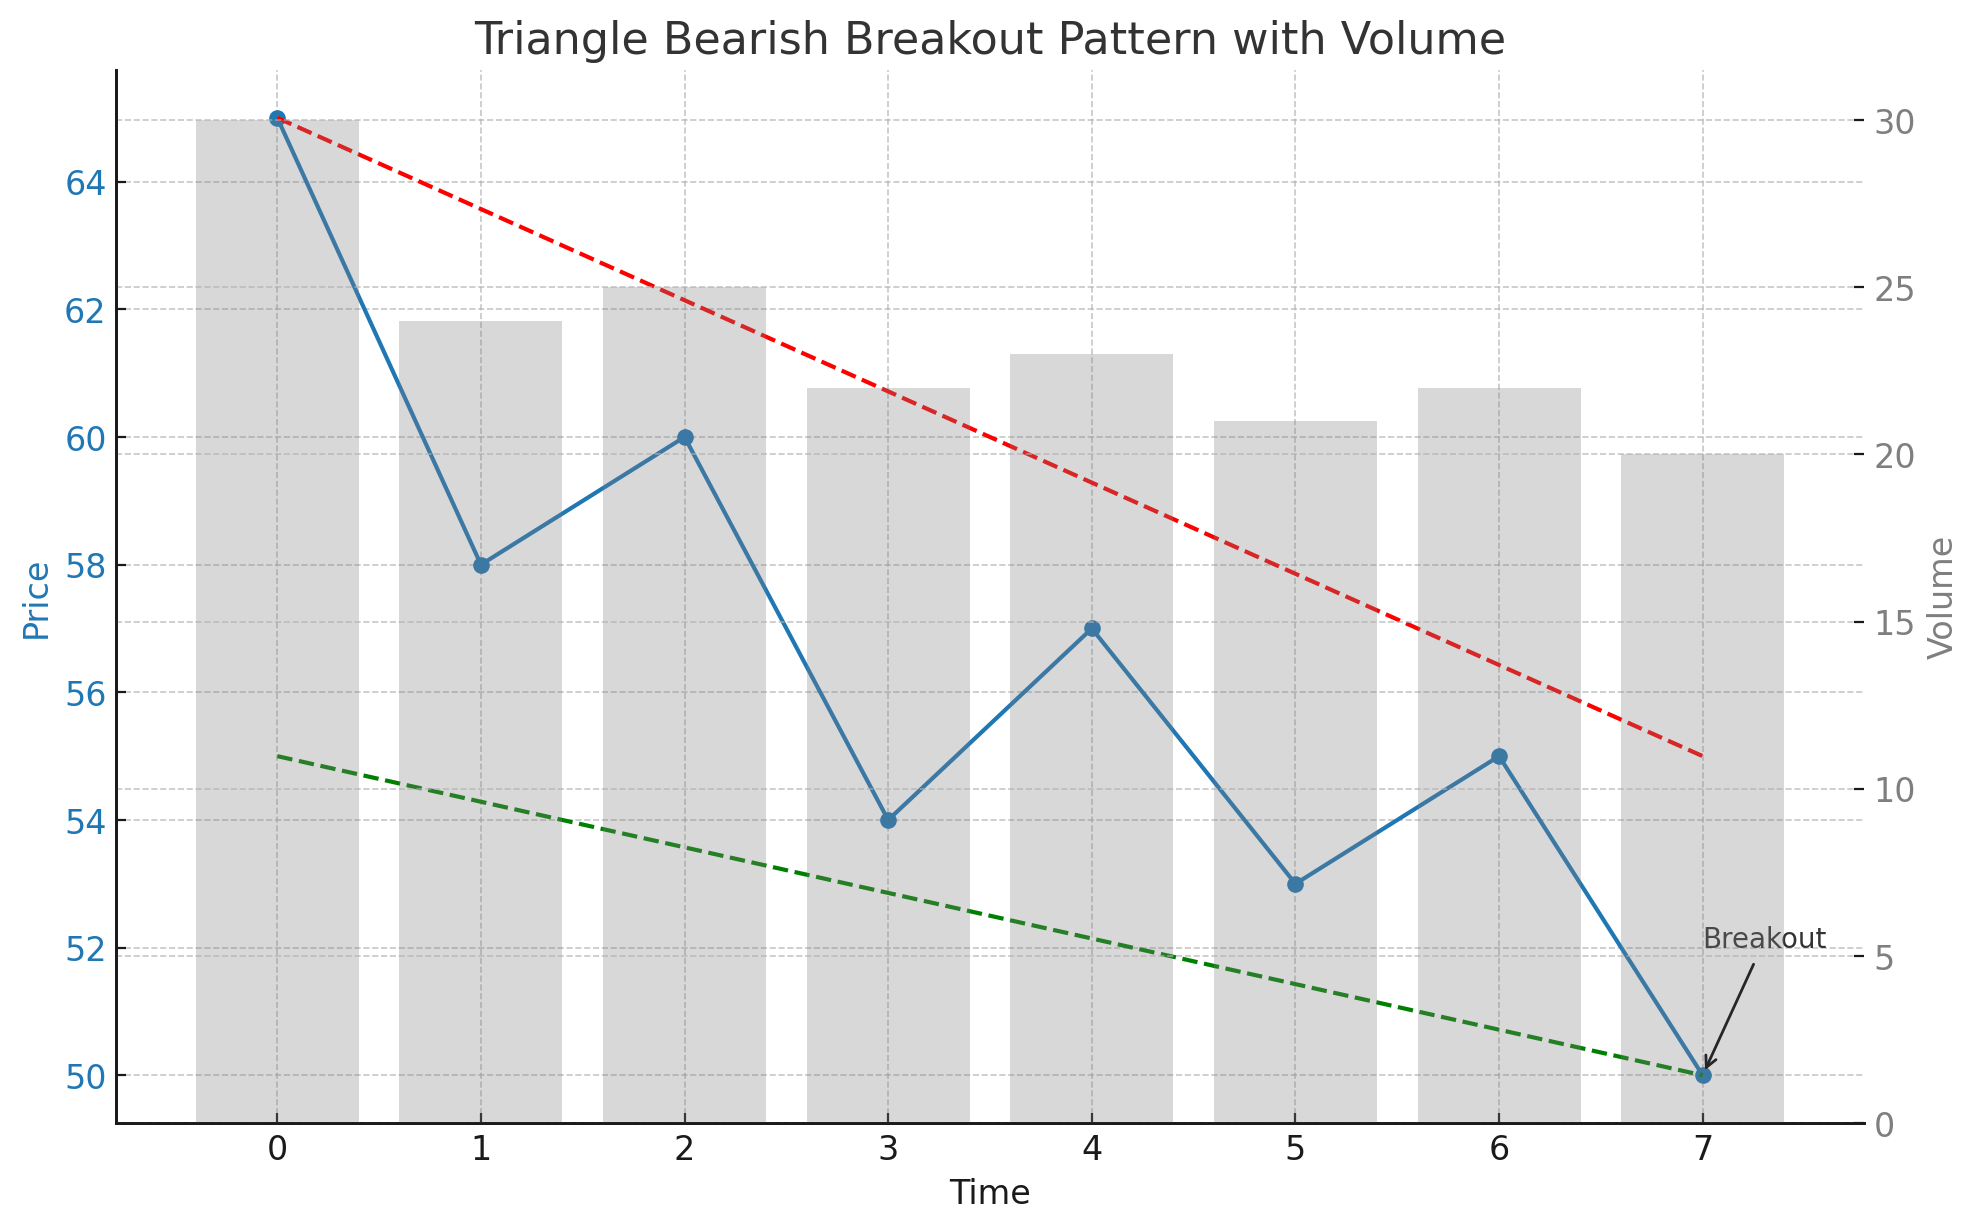
Triangle Bearish Breakout Pattern with Volume Analysis
This example highlights the role of volume in confirming the Triangle Bearish Breakout pattern. Volume analysis can provide additional confidence in the pattern's validity.
- Downtrend: The price trend is downward, characterized by decreasing prices and moderate volume.
- Consolidation: The price consolidates within converging trendlines with moderate volume.
- Breakout: The price breaks below the lower trendline with a significant spike in volume, confirming the pattern.
Triangle Bearish Breakout Pattern with Volume
Frequently Asked Questions
What is the Triangle Bearish Breakout pattern in stock trading?
The Triangle Bearish Breakout pattern in stock trading is a continuation pattern that appears during a downtrend. It indicates a potential continuation of the downward movement and is characterized by the price consolidating within converging trendlines before breaking out to the downside.
How reliable is the Triangle Bearish Breakout pattern in stocks?
The Triangle Bearish Breakout pattern is considered a reliable bearish continuation signal in stock trading, especially when confirmed by increased trading volume and a strong breakout below the lower trendline. However, it should be used alongside other technical analysis tools.
Can the Triangle Bearish Breakout pattern appear in any stock?
Yes, the Triangle Bearish Breakout pattern can appear in any stock. It is a widely applicable chart pattern used in technical analysis across various assets, including stocks.
What common mistakes should be avoided when trading the Triangle Bearish Breakout pattern?
Common mistakes include entering the trade too early before the breakout confirmation, not confirming the pattern with volume analysis, and failing to set appropriate stop-loss levels to manage risk. By understanding and utilizing the Triangle Bearish Breakout pattern, traders can better anticipate bearish continuations and optimize their trading strategies for improved outcomes in the stock market.
What are the key indicators to consider when trading the Triangle Bearish Breakout pattern in stocks?
Key indicators include identifying significant trendlines, confirming the pattern with increased volume during the breakout, and observing bearish candlestick patterns near the breakout point. These indicators help validate the Triangle Bearish Breakout pattern and provide insights for potential significant price movements.